One popular use of the RSI is to
determine divergence. Divergence is a compelling tool that can discover looming
market reversals, by comparing RSI value and shares’ price movements.
When you
trade ETF, if the trending momentum (which is justified by RSI) does not
bolster the price, an implied reversal might be in sight. Basically divergence can be
classified as two different types of divergence: one is bullish divergence, the
other one is bearish divergence.
Negative divergence occurs when a
share’s price records higher high, but the RSI does not reach higher high
accordingly.
For example, if an ETF is making a
new high, while the RSI is not, this is an indication that the uptrend may be
ending soon (bearish divergence). The signal usually comes when the RSI line
drops below its most recent trench.
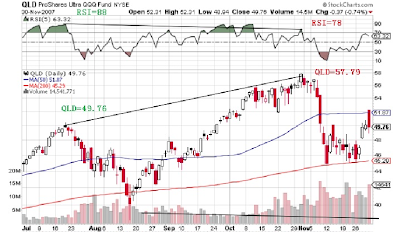
QLD
(ProShares Ultra QQQ) tallies to two times the daily performance of the NASDAQ-100
index. The following chart exhibits that on 7/19/2007, QLD closed at 49.76 on
7/19/2007, the highest price of that cycle. The RSI (5) reading was 88. On 10/31/2007, QLD reached a multiple years’
high at 57.79. However, the RSI (5) was 78, which did not close at a higher
high. The negative divergence was
formed. The QLD had a sharp dive since then until March 2009.
Negative divergence example
for QLD from 7/1/2007 to 11/30/2007.
Source:
Line Graph Outline form StockCharts.com.
Actual data compiled by Authors.
Thanks for your visiting and reading. Come back more often, more updates to come.
Have a great day!
+chart.png)
No comments:
Post a Comment