Have you read the article “How to Detect the
Short-Term Market Reversal by ISE Sentiment Index?” http://top5indicators.blogspot.com/2013/09/how-to-detect-market-reversals-by-ise.html.
If so, you should have learned that when ISE
Sentiment Index rises dramatically and shows extreme bullishness, the market
might have reached the short-term topping.
On the other hand, Relative Strength Index (RSI)
tells us when market stays in overbought status for a while, the market might
take a breathe and swing to the other side. You can learn more from the other
article:
“How to Combine ISE Sentiment Index and Relative
Strength Index to Detect Market Reversal” (http://top5indicators.blogspot.com/2013/09/how-to-profit-from-stock-market-by_17.html).
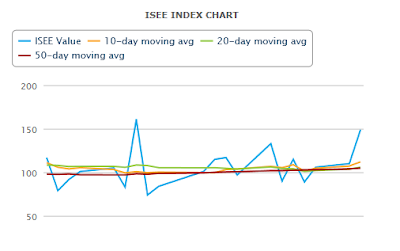
We checked our daily log, we found that ISEE closed
at 149 and reached an intraday high of 181which has been seen for a while. Here
is the chart, you can see the movement for the last 30 days.
Chart
1. Source: Line Graph Outline form
http://www.ise.com. Actual data compiled
by Authors.
Chart 2. Source: Line Graph Outline form
StockCharts.com. Actual data compiled by
Authors.
I am not saying there will be an imminent market
reversal, but we are going to take cautious stand, and take some profit off
table.
Dear readers, what is your view about the current
stock market, bullish, bearish, or neutral?
Thanks for your visiting and reading.
Have a great day!


No comments:
Post a Comment